

“If you can’t measure it, you can’t improve it.”
This quote, attributed to Peter Drucker, has held a lot of sway over the years in management circles where high-level business processes are created, iterated, tweaked, and refined to ensure that revenues (and hopefully, profits) lead to healthy, long-lasting companies.
At Blue Sentry, our Managed Services offering is built upon this same maxim. We rely on several tools to provide insight into customer environments; in this post, I am going to focus on one of my favorites from this toolset – Datadog – and its ability to capture custom metrics.
Out of the box, Datadog comes with a wealth of metrics for most imaginable use cases: Apache, disk utilization, memory utilization, CPU utilization, Hadoop, Consul, and many others. But even with this great set of integrations right out of the box, there will always arise a need for custom metrics. With a very little bit of work, Datadog makes it extremely easy to instrument your applications and consequently build some very slick dashboards to give you a good holistic idea of how your application (or system) is performing.
In my case, I was instrumenting an application I built to parse text out of documents of various formats. I built the solution leveraging the Textract library; incoming documents are placed in an S3 bucket that populates an SQS queue when documents arrive. The metrics that I care about for this application are basically the number of documents that it can parse over various time intervals, be it minute, hour, or day, and how many instances of the worker process are running on a given host at any one time.
Since the output of my application is stored in Aurora, instrumenting the parse rate is simply a matter of writing a few different SQL queries (since I’m storing a timestamp on each output record) and adding them into Datadog’s MySQL integration, yielding something like this (I’ve redacted the actual connection configuration and two of the queries to save space – they follow a similar pattern as the query displayed):
...
instances:
  -
    server: [redacted]
    user: [redacted]
    pass: [redacted]
    port: 3306

    queries:
      - # Daily Document Extractions
      ... [redacted for brevity] ...

      - # By-Minute Document Extractions
      ... [redacted for brevity] ...

      - # By-Hour Document Extractions
        query: SELECT COUNT(*) AS by_hour_total FROM extractions WHERE processed BETWEEN CONCAT(CURDATE(), ' ', HOUR(CURRENT_TIME()), ':00:00') AND CONCAT(CURDATE(), ' ', HOUR(CURRENT_TIME()), ':59:59');
        metric: extractions.total.by_hour
        tags:
            - document_extraction
        type: gauge
        field: by_hour_total
Once your metrics are being shipped off to Datadog, it’s extremely easy to build a quick dashboard. This dashboard encapsulates the metrics gathered from the previously discussed queries (left-hand column) as well as a metric gathered via a different route (right-hand column, which I’ll discuss in a future post).
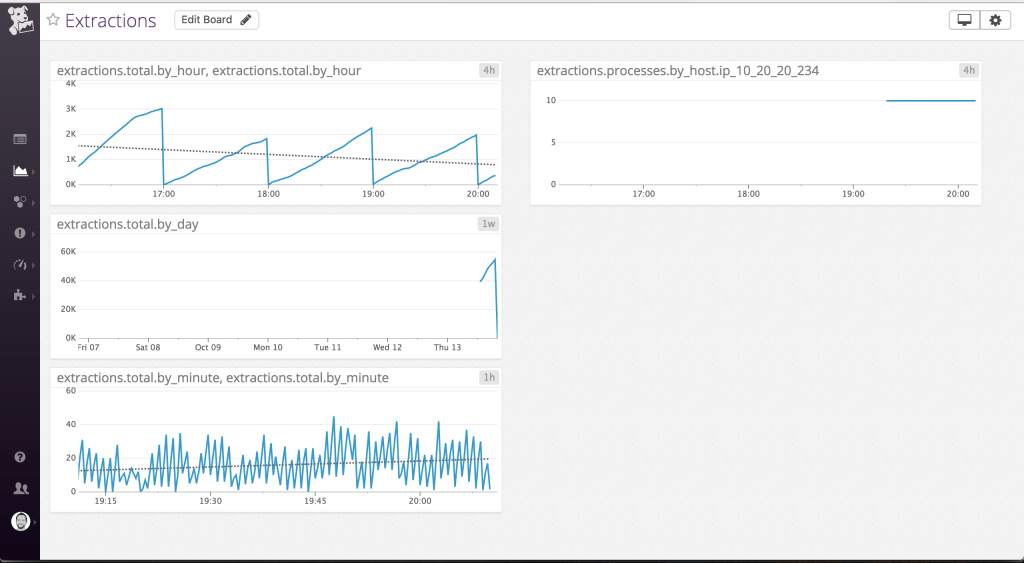
Datadog makes it incredibly easy to fit trendlines based on least-squares regression to your plots, which you can see that I have done in the “by hour” and “by minute” charts. I have also set the display interval on each chart to one that seems appropriate to me (i.e. a 4-hour view for the by-hour metric, a 1-hour view for the by-minute metric).
Given that many types of applications store transaction data in some sort of database, the power of Datadog is quickly realized in its out-of-the-box support for many SQL and NoSQL backends and that it allows custom queries to be added to those out-of-the-box integrations. Happy monitoring!